If you’ve met me at a conference, or on the Internet, or maybe even in passing on the street, I have probably talked your ear off about story tables. Why do I love story tables so much?
One part has to do with learning the language of algebra. I believe that fluency with algebraic symbols is one key to the “math clubhouse;” it separates those people who perceive they “can do math” from those who believe they “can’t.” Activist Bob Moses of the Algebra Project takes it a step further calling fluency in algebra “the gatekeeper for citizenship” (Moses and Cobb, 2001, p. 14).
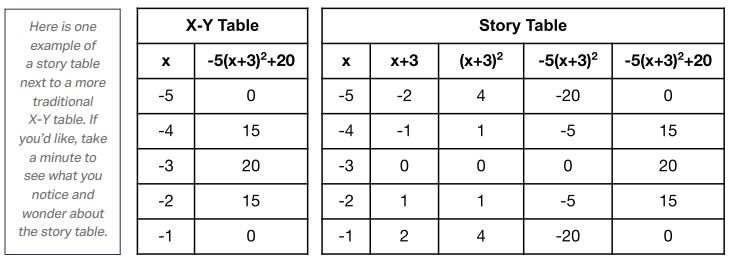
Six years ago, my colleague and I were brainstorming a way to support students to develop this kind of fluency. We had the idea to stretch out the traditional x-y table so there was one column for each step between x and y. These would eventually be called story tables because they helped students see the story of numbers as they transform from inputs to outputs. Three years later, this same idea would cause me to stain the back of a student’s pre-calculus honors placement test with tears of joy.
“I’m good at math,” he wrote.
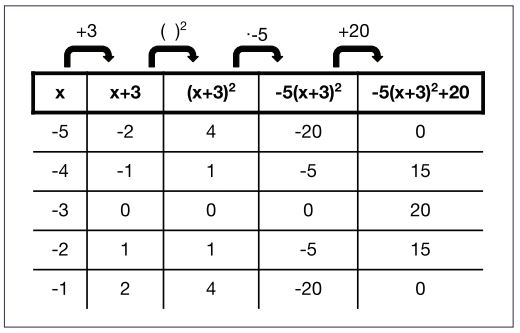
Ariel1, a student in my Algebra 1 class last year, noticed that the headings of the tables are helpful to understand the meaning of each symbol. For example, the -5 in -5(x+3)2+20, which sometimes looks like multiplication and sometimes looks like subtraction, represents multiplying all of the values by -5.
At the beginning of Algebra 1, Ariel had told me that math felt like an “alien language.” By the end of the year, her questions like “Does the dash in y=6-(x+3)2 mean a multiplying by -1?” pushed the entire class to deeper understanding.
“I’m good at math,” he wrote.
Andre noticed that there is a whole lot of symmetry in the story table of a parabola like this one.
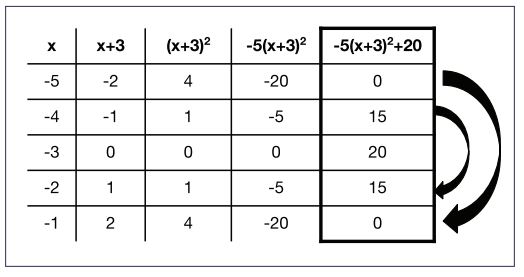
Andre was a student who always wanted to share his ideas, but whose ideas weren’t always respected by the rest of the class. One day, he pointed out that the symmetry starts in the third column: “(-2)2 = 4 and 22 = 4, so all the numbers after are the same.”
Our class called Andre’s realization the “Dre-ainbow.” We used the Dre-ainbow to make sure we were using the best inputs for our tables of parabolas and to help find key features, like the vertex and x-intercepts.
“I’m good at math,” he wrote.
Daniela noticed that the middle row of some story tables have a whole string of 0s in the center. She connected this row with the highest point, or vertex, of a parabola.
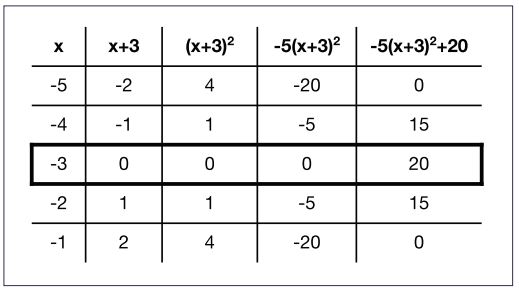
We called this “Daniela’s Rule” and used it to help us identify the vertex directly from an equation. Before this, Daniela had convinced herself that she could never do math because learning differences made keeping many different steps in her head a challenge. After this, she was more willing to share her ideas with her partners and the class.
“I’m good at math,” he wrote.
Hector realized that you could extend Daniela’s strategy to model equations of parabolas if you know the vertex and another point.
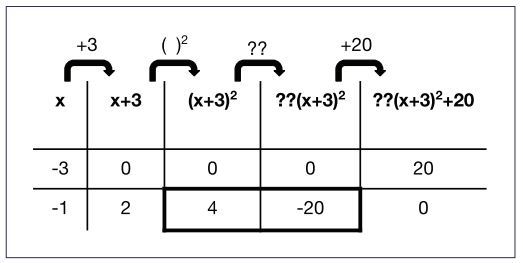
Hector started by putting the vertex into the first and last column of the table with zeros in the middle: “If you know those, then you can figure out the addition or subtraction parts of the equation. In order to figure out the ‘multiply number’ you need one more point.” In this case, If you use (-1,0) as a second point, the only way to get from 4 to -20 by multiplying is to use the number -5.
I gasped out loud when I realized that you could extend Hector’s strategy to find the equation of a line through two points using a story table.
“I’m good at math,” he wrote.
Kaya saw that sometimes the x-intercepts appeared in the table and sometimes they did not. However, you could always find the x-intercepts by putting zero at the end and working backwards to find the input.
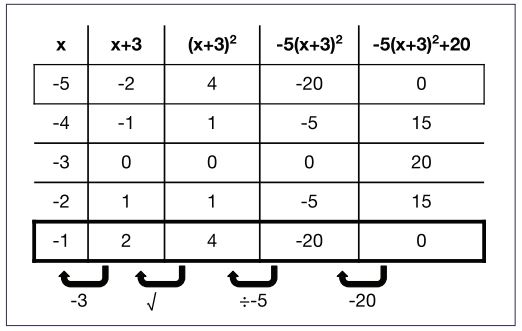
Mei used Kaya’s strategy to teach half our class how to solve the most complex equations on a challenging quiz.
“I’m good at math,” he wrote.
I taught Matthew both Geometry and Algebra 2. If I had a dime for every time he said that math wasn’t for him, I’d—well, you know the end of that quote. He ended up earning a D in Geometry and needed to repeat the class.
Some time in mid-November of Algebra 2, things changed. We were studying transformations of functions using story tables. I asked Matthew to write his idea on the board.
Story tables have opened doors to switch the narrative about who is capable of deep and useful knowledge in math and have helped to unlock the deep mathematical creativity my students have always been capable of using.
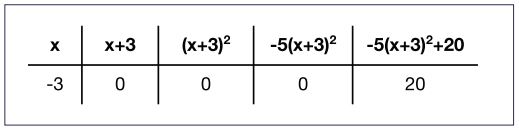
Matthew didn’t need to draw the whole story table at all. He realized that you could learn a lot about a story table just by looking at the headings and the critical point. This strategy was useful because it meant that we could focus on the most important point of the graph, making it easier to quickly understand how a function behaves. It was more than that, though. Matthew took a tool we had always used a certain way (by choosing the best five inputs) and questioned the assumptions of how it could or should be used.
We called the one-row method “Matthew’s Rule,” which proved to be exceptionally handy as we sketched and discussed key features of functions like cubics, square roots and cube roots.
Five months later, I blubbered onto the back of his pre-calculus honors placement exam.
“I’m good at math,” Matthew had written.
So why do I love story tables?
Story tables have opened doors to switch the narrative about who is capable of deep and useful knowledge in math and have helped to unlock the deep mathematical creativity my students have always been capable of using.
On her first day of school, Mei told me that learning math in another country made it really hard for her to understand math taught here; she said she always mixed up the symbols. With story tables, she ended up positioned in our class as an expert on solving equations. Ariel, Andre, Daniela, Hector, Kaya, Mei, Matthew and others used story tables to create brilliant strategies for procedures I otherwise would have presented to students. As students authored the rules, we credited them and used their ideas to push our own understanding. These students (and their ideas) were elevated in a way that society does not typically elevate people of particular races, genders, classes, and neurotypes. Some of them even rewrote their own stories about who they are as mathematicians and as learners.
I can’t tell you that story tables fix it all. Teaching is far too complex and rich for one tool to help every student understand every concept deeply and flexibly. There are situations for which story tables are cumbersome; for example, equations with more than one instance of x, like 3(x+5)(x-7), can be difficult to parse. In the wrong context, story tables can become just another procedure. Furthermore, story tables don’t directly counter any of the parts of society that can make learning in schools an unsafe place.
What I can say is that story tables are one tool my students and I use to honor and appreciate the beauty and brilliance of mathematics and the beauty and brilliance of each other.
“I’m good at math,” he wrote.
My students always had been.
1 All student names are pseudonyms
Shira Helft, a Knowles Senior Fellow, loves puzzles of all kinds. This led to her infatuation with math and math learning; she is fascinated by the ways people think through ideas and how this affects their identity and power in society. Shira has been fortunate enough to learn as a teacher, coach, curriculum lead, and professional development coordinator at schools in the Bay Area. She now is a lesson developer at Desmos, whose mission is for all students to love math and love learning math. In her spare time, Shira grows her brain with cryptic crosswords, puzzle hunts, and chasing the best dumplings in the Bay Area. Reach Shira on Twitter @MsHelft or by email at shira.helft@knowlesteachers.org.
Share: